herodotus
Well-known member
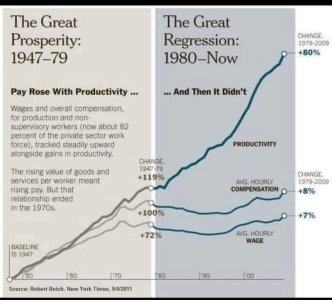
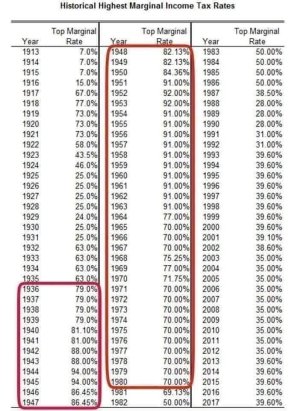
Due to years of education in history and training and electroshock therapy, I have come to ask on various things "how did we get here?" "why are we here?" and "what happened to get us here." Be it foreign policy or domestic policy, I like asking this. So lets look at the economy in charts. I swear I am not Ross Perot, and no MAGAsses, although a billionaire there is no other similarity to Trump. Ross was a self made billionaire and while flawed I never had any reason to believe he did not love this country and its people. Anyways lets look at charts and graohs. These all paint a picture that speaks for itself-
Click the link for housing costs, look at the other graphs and tell me what you see. What patterns emerge? What stands out to you?


Click the link for housing costs, look at the other graphs and tell me what you see. What patterns emerge? What stands out to you?

Median Sales Price of Houses Sold for the United States
Graph and download economic data for Median Sales Price of Houses Sold for the United States (MSPUS) from Q1 1963 to Q1 2025 about sales, median, housing, and USA.
fred.stlouisfed.org


Last edited:
